Don’t Just Look at the Average! Uncover the True Shape of Your Data
Want to do this 👆🏻👆🏻👆🏻? Read This!

Have you ever noticed how some things in life seem to follow predictable patterns? Think about the heights of adult humans — most people are of average height, with fewer individuals being exceptionally tall or short. This natural clustering of data around a central value is a fundamental concept in statistics, and it’s captured by the idea of data distributions.
Just like a landscape can be mountainous, flat, or have rolling hills, data can also exhibit different shapes and characteristics. Understanding these distributions is crucial because they provide valuable insights into the data’s behavior, helping us make informed decisions and draw meaningful conclusions. In this article, we’ll explore some of the most common data distributions, from the familiar bell curve to the more unusual skewed shapes.
What is Data Distribution?
Data distribution describes how data points are spread or scattered across a range of values within a dataset. It essentially outlines the pattern or arrangement of your data, revealing how frequently certain values occur and how they are clustered or dispersed.
Understanding data distributions is crucial in statistics and data analysis. It provides valuable insights into the central tendency (mean, median, mode), variability (spread), and shape of the data. This knowledge helps in selecting appropriate statistical methods, interpreting results accurately, and making informed decisions based on the data.
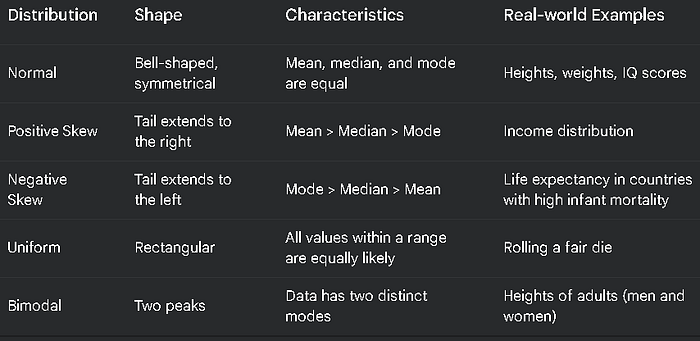
1. The Bell Curve: The Normal Distribution
The normal distribution, often depicted as a bell-shaped curve, is arguably the most famous distribution in statistics. It’s characterized by its symmetry around the mean, with most data points clustered around the center and gradually tapering off towards the tails.
Key Characteristics:
- Symmetrical: The left and right halves of the curve are mirror images of each other.
- Bell-shaped: The curve rises smoothly to a peak at the mean and then declines symmetrically on both sides.
- Mean, median, and mode are all equal.
Real-world Examples:
- Heights and weights of individuals in a population
- IQ scores
- Measurement errors in scientific experiments
Significance:
- Many natural phenomena and human characteristics tend to follow a normal distribution.
- It forms the basis for many statistical tests and inferential procedures.
2. Skewed Distributions:
Skewed distributions, unlike the symmetrical normal distribution, have a longer tail on one side.
Positive Skew (Right Skew):
- The tail extends towards the right side of the distribution.
- Mean > Median > Mode
- Examples: Income distribution (where a few high earners skew the data), waiting times in a queue.
Negative Skew (Left Skew):
- The tail extends towards the left side of the distribution.
- Mode > Median > Mean
- Examples: Life expectancy in countries with high infant mortality rates, grades on an easy exam.
3. Uniform Distribution:
In a uniform distribution, all values within a specific range are equally likely.
Key Characteristics:
- Rectangular shape when plotted on a graph.
- All values within the range have the same probability.
Real-world Examples:
- Rolling a fair die (each number has an equal chance of appearing)
- Random number generators
4. Bimodal Distribution:
A bimodal distribution has two peaks, indicating that the data has two distinct modes.
Key Characteristics:
- Two distinct peaks or humps in the distribution.
- May arise from a mixture of two different populations or underlying processes.
Real-world Examples:
- Heights of adults in a population that includes both men and women (men tend to be taller on average)
- Daily traffic patterns (may have peaks during morning and evening rush hours)
5. Identifying and Visualizing Distributions:
- Histograms: Histograms are the most common graphical tool for visualizing data distributions. They divide the data into intervals (bins) and plot the frequency of data points within each bin.
- Probability Density Plots: These plots provide a smooth curve that represents the probability density of the data at different values.
- Box Plots: While primarily used for visualizing variability, box plots can also provide insights into the shape of the distribution by showing the presence of outliers and the skewness of the data.
6. Python Implementation
Here’s a Python code snippet demonstrating how to visualize a normal distribution using the matplotlib and numpy libraries:
import numpy as np
import matplotlib.pyplot as plt

# Generate random data from a standard normal distribution
data = np.random.normal(loc=0, scale=1, size=1000)

# Create a histogram
plt.hist(data, bins=30, density=True, alpha=0.6, color='blue')

# Plot the probability density function (PDF) of the standard normal distribution
x = np.linspace(-4, 4, 100)
plt.plot(x, 1/(np.sqrt(2*np.pi))*np.exp(-0.5*x**2), color='red')

plt.xlabel('Value')
plt.ylabel('Probability Density')
plt.title('Normal Distribution')
plt.show()
7. Importance of Understanding Distributions
- Data Interpretation: Understanding the underlying distribution of data helps in interpreting and summarizing data effectively.
- Statistical Inference: Many statistical tests and models assume specific data distributions (e.g., t-tests assume normally distributed data).
- Decision Making: Knowledge of data distributions can inform decision-making processes in various fields, such as finance, healthcare, and engineering.
- Predictive Modeling: Accurate modeling often requires understanding the distribution of the variables involved.
Table 1: Summary of Common Data Distributions
Conclusion
Understanding data distributions is not merely an academic exercise; it’s a fundamental skill for anyone working with data. By recognizing the patterns and shapes that data takes, we move beyond simple summaries and gain a deeper understanding of the underlying phenomena.
The normal distribution, with its symmetrical bell curve, provides a foundational framework for many statistical analyses. However, real-world data rarely conforms perfectly to this ideal. Skewed distributions, bimodal distributions, and uniform distributions, among others, offer valuable insights into the unique characteristics of different datasets.
Knowledge of data distributions has far-reaching implications:
- Improved Decision-Making: By understanding the distribution of key variables, businesses can make more informed decisions about marketing strategies, product development, and risk management.
- Enhanced Data Analysis: Recognizing the underlying distribution of data allows for the selection of appropriate statistical tests and models, leading to more accurate and reliable results.
- Scientific Discovery: In fields like medicine, biology, and physics, understanding data distributions is crucial for interpreting experimental results, identifying trends, and making breakthroughs in research.
- Machine Learning: Many machine learning algorithms rely on assumptions about the distribution of data. Understanding these distributions is essential for building effective and accurate predictive models.
In conclusion, the study of data distributions is a cornerstone of data analysis. By exploring the diverse shapes and patterns that data can take, we gain a deeper understanding of the world around us, make more informed decisions, and unlock the full potential of data-driven insights.
Key Takeaways:
- Data distributions describe the way data points are spread or scattered across a range of values.
- Common distributions include normal, skewed, uniform, and bimodal distributions.
- Understanding data distributions is crucial for data interpretation, statistical inference, decision-making, and machine learning.
- Visualizing data through histograms, density plots, and box plots helps in understanding and interpreting distributions.