Stop Guessing, Start Proving: A Deep Dive into Hypothesis Testing
Want to know 👆🏻👆🏻👆🏻? Click Here!

Imagine you’re a baker, and you’ve developed a revolutionary new recipe for chocolate chip cookies. You believe your cookies are truly special, with a unique flavor and texture that will blow customers away. But how do you prove it? How can you demonstrate to the world that your cookies are indeed superior to the competition? This is where the powerful tool of hypothesis testing comes into play.
Hypothesis testing is like a detective story, where we use data to investigate a claim or belief. In our cookie example, our claim is that our cookies are superior. We’ll gather evidence (customer feedback, taste tests, sales data) and use statistical methods to determine if our claim holds water or if it’s just wishful thinking.
This article will delve into the fundamental concepts of hypothesis testing, guiding you through the process of formulating hypotheses, collecting and analyzing data, and interpreting the results.
What is Fundamentals of Hypothesis Testing
Hypothesis testing is a formal statistical procedure used to make decisions about a population based on sample data. It involves a set of steps to evaluate a claim or belief about a population parameter (such as the mean, proportion, or variance).
Key Steps in Hypothesis Testing:
Formulate Hypotheses:
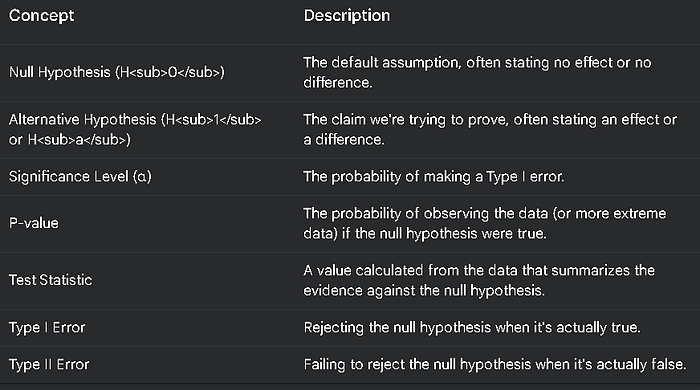
- Null Hypothesis (H<sub>0</sub>): This is the default assumption, often stating no effect or no difference. It’s the statement we initially assume to be true.
- Alternative Hypothesis (H<sub>1</sub> or H<sub>a</sub>): This is the claim we’re trying to prove, often stating an effect or a difference. It’s the opposite of the null hypothesis.
Set the Significance Level (α):
- The significance level (α) is the probability of rejecting the null hypothesis when it is actually true.
- It’s a predetermined threshold, typically set at 0.05 (5%).
- A lower α value reduces the risk of a Type I error but increases the risk of a Type II error.
Collect Data and Calculate Test Statistic:
- Collect a sample from the population and calculate the appropriate test statistic based on the chosen hypothesis test (e.g., t-test, z-test, chi-square test).
- The test statistic measures how far the sample data deviates from what would be expected under the null hypothesis.
Determine the P-value:
- The p-value represents the probability of observing the sample data (or more extreme data) if the null hypothesis were true.
- It’s calculated based on the test statistic and the chosen test.
Make a Decision:
- Compare p-value to α:
- If p-value ≤ α, reject the null hypothesis. This suggests strong evidence in favor of the alternative hypothesis.
- If p-value > α, fail to reject the null hypothesis. This means we don’t have enough evidence to conclude that the alternative hypothesis is true.
Interpret Results and Draw Conclusions:
- State the conclusion clearly and concisely based on the decision made.
- Acknowledge any limitations or potential biases in the study.
Types of Hypothesis Tests:
- t-test: Used to compare means between two groups or compare a sample mean to a known population mean.
- z-test: Used when the population standard deviation is known or when the sample size is large.
- Chi-square test: Used to analyze categorical data, such as frequencies or proportions.
- ANOVA (Analysis of Variance): Used to compare means among three or more groups.
Key Concepts:
- Type I Error: Rejecting the null hypothesis when it is actually true.
- Type II Error: Failing to reject the null hypothesis when it is actually false.
- Statistical Power: The probability of correctly rejecting the null hypothesis when it is false.
Example:
Let’s say a pharmaceutical company claims that a new drug reduces blood pressure more effectively than a placebo.
- Null Hypothesis (H<sub>0</sub>): The new drug does not reduce blood pressure more effectively than the placebo.
- Alternative Hypothesis (H<sub>1</sub>): The new drug reduces blood pressure more effectively than the placebo.
The company would conduct a clinical trial, collect data on blood pressure measurements, and perform a hypothesis test to determine if the data supports the claim that the new drug is more effective.
1. The Foundation: Core Concepts
- Hypotheses: The Two Sides of the Coin
At the heart of hypothesis testing lie two competing statements:
* **Null Hypothesis (H<sub>0</sub>):** This is the status quo, the default assumption. In our cookie example, the null hypothesis might be: "There is no significant difference in taste between our cookies and the leading brand." Essentially, it assumes that our cookies are not any better.
* **Alternative Hypothesis (H<sub>1</sub> or H<sub>a</sub>):** This is the claim we're trying to prove. In our cookie case, the alternative hypothesis could be: "Our cookies are significantly more preferred in taste compared to the leading brand."- Significance Level (α):
The significance level is like a threshold for our decision. It’s typically set at 0.05 (or 5%), meaning we’re willing to accept a 5% chance of mistakenly rejecting the null hypothesis when it’s actually true. This is known as a Type I error.
- P-value: The Strength of Evidence
The p-value is a crucial piece of the puzzle. It represents the probability of observing the data we collected (or more extreme data) if the null hypothesis were true. A low p-value (typically less than 0.05) suggests strong evidence against the null hypothesis.
- Test Statistic:
A test statistic is a value calculated from the data that summarizes the evidence against the null hypothesis. Different types of tests (t-test, chi-square test, etc.) use different test statistics.
Type I and Type II Errors:
- Type I Error: As mentioned earlier, this occurs when we reject the null hypothesis when it’s actually true. In our cookie example, it would mean declaring our cookies superior when they’re not.
- Type II Error: This happens when we fail to reject the null hypothesis when it’s actually false. In our cookie case, it would mean failing to recognize the superiority of our cookies.
2. Choosing the Right Weapon: Selecting the Appropriate Test
The choice of the hypothesis test depends on several factors:
Type of Data:
- Categorical: Deals with categories (e.g., gender, brand preference). Examples: Chi-square test, Fisher’s exact test.
- Continuous: Deals with numerical values (e.g., height, weight, temperature). Examples: t-test, ANOVA.
Number of Groups:
- Two Groups: Comparing two sets of data (e.g., our cookies vs. competitor’s cookies).
- More Than Two Groups: Comparing multiple groups (e.g., comparing the taste of cookies baked at different temperatures).
Research Question:
- Is there a difference between groups?
- Is there a relationship between variables?
3. The Data Collection and Analysis Phase
Once we’ve chosen the appropriate test, we collect the necessary data. In our cookie example, we might conduct a blind taste test with a group of participants. We then analyze the data using statistical software to calculate the test statistic and the corresponding p-value.
4. Interpreting the Results and Making Decisions
Compare p-value to Significance Level:
- If p-value ≤ α (e.g., p-value ≤ 0.05), we reject the null hypothesis. This suggests that there’s strong evidence in favor of our alternative hypothesis (our cookies are indeed superior).
- If p-value > α, we fail to reject the null hypothesis. This means we don’t have enough evidence to conclude that our cookies are significantly better.
Draw Conclusions:
- Based on the outcome of the hypothesis test, we can draw conclusions about our claim. If we reject the null hypothesis, we can confidently state that our cookies are superior. If we fail to reject it, we need to re-evaluate our recipe or consider other factors.
5. Communicating Findings Effectively
Clearly and concisely communicating the results of hypothesis testing is crucial. This involves:
- Summarizing the findings in plain language: Avoid jargon and technical terms when explaining the results to a non-technical audience.
- Visual aids: Use graphs, charts, and tables to effectively present the data and findings.
- Acknowledging limitations: No study is perfect. Acknowledge any limitations or potential biases in the study design or data collection process.
6. A Python Example: One-Sample T-test
Let’s consider a scenario where we want to test if the average weight of a certain type of apple exceeds 150 grams.
import scipy.stats as stats

# Sample apple weights (in grams)
apple_weights = [155, 148, 162, 150, 145, 158, 160]

# Define the null hypothesis mean
null_mean = 150

# Perform one-sample t-test
t_statistic, p_value = stats.ttest_1samp(apple_weights, null_mean)

print("t-statistic:", t_statistic)
print("p-value:", p_value)

# Interpret the results
alpha = 0.05
if p_value < alpha:
    print("Reject the null hypothesis. The average apple weight is significantly greater than 150 grams.")
else:
    print("Fail to reject the null hypothesis. There is not enough evidence to conclude that the average apple weight is significantly greater than 150 grams.")
Table 1: Summary of Key Hypothesis Testing Concepts
Conclusion: A Deeper Dive into the Significance of Hypothesis Testing
Hypothesis testing serves as the cornerstone of modern scientific inquiry and data-driven decision-making across diverse fields. By providing a rigorous framework for evaluating claims and drawing meaningful conclusions from data, it empowers researchers, analysts, and practitioners to move beyond mere speculation and embrace evidence-based approaches.
From the intricacies of medical research, where hypothesis testing guides the development of new treatments and therapies, to the complexities of market analysis, where it informs strategic business decisions, the impact of this statistical methodology is profound. By carefully formulating hypotheses, collecting relevant data, and conducting appropriate statistical analyses, we can gain valuable insights into the world around us, identify meaningful patterns, and make informed judgments with greater confidence.
However, it is crucial to remember that hypothesis testing is not without its limitations. The validity of any hypothesis test relies heavily on the quality of the data collected and the assumptions underlying the chosen statistical method.
Furthermore, while statistical significance is an important consideration, it should not be the sole determinant of the importance or relevance of a finding. Contextual factors, practical implications, and the potential impact on society must also be carefully weighed.
In conclusion, hypothesis testing is a powerful tool that, when used judiciously and with a critical eye, can illuminate the path to knowledge and inform evidence-based decision-making in a wide range of human endeavors. As our understanding of the world around us continues to evolve, so too will the sophistication and application of hypothesis testing, ensuring its continued relevance in the years to come.